Idea Roulette with the Random Build Generator
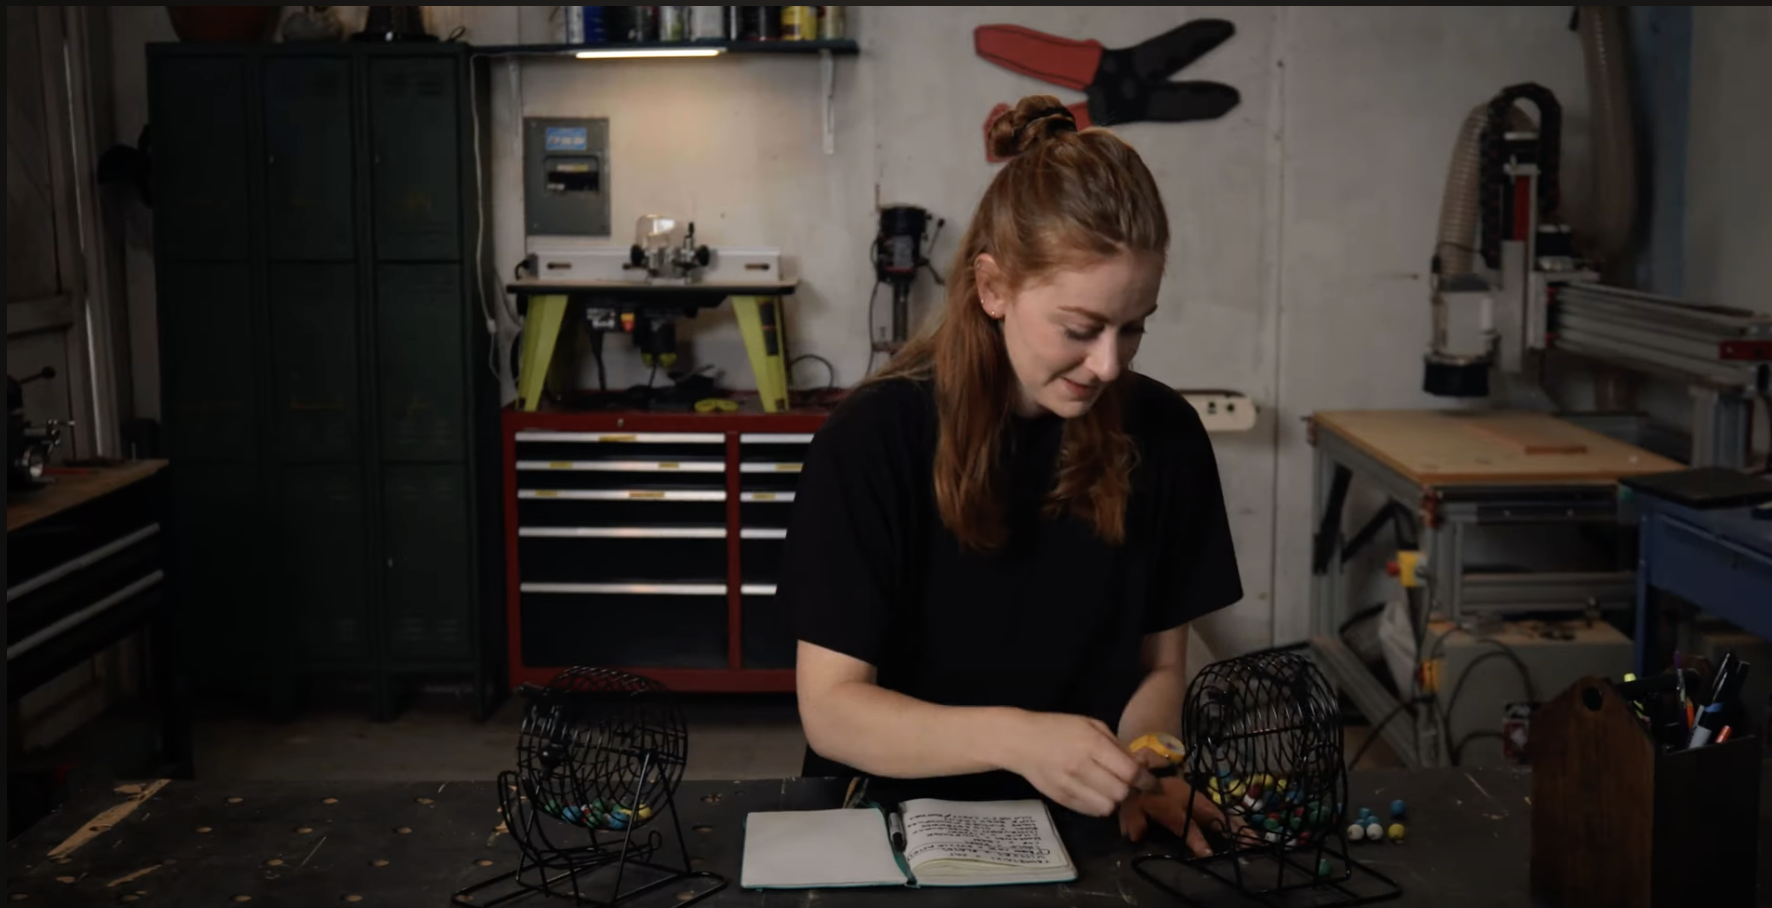
Simone Giertz is all about creating “non-useful” engineered objects. Robots designed for silly uses. Her practice is all about finding absurd and beautiful ways of creating projects. One of her strategies is to generate her build randomly, using two bingo cages. The first bingo cage gives an idea for what to create, while the second randomly generates an idea for the material used to create that object. You can see this process in action in her class trailer:

We created a digital equivalent of Simone’s two-bingo-cage process. Madi Ng designed it, and I was responsible for building the feature. Here’s a demo.
The most fun and complex part of creating the random build generator was something unobtrusive, but entirely necessary: the connecting line. It took a lot of trial, error, and testing, but here, at a high level, is how we built it.

Constructing the Curve
Take a look at this screenshot of the Random Build Generator. What do you see?
Looks like one single, connecting curve, right? Well, sort of.
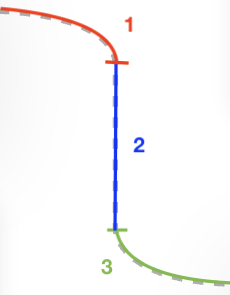
The curve here is actually made up of three cubic bezier curves, which change dynamically whenever a new item is selected in either column.
SVG curve 101:
path is the name of the SVG element that’s used for
drawing a curve or line. It is very, very powerful! MDN has a
good reference, which I used a great deal in both developing this feature and
in writing this explanation!
In this example, we’re using is the d attribute,
which draws the path. I like to think of
d's value as a string of code commands, à la
turtle programming. For this curve, we have two general kinds of
commands:
-
M: TheMattribute moves the element across the XY plane of the SVG box. Think of it as “translation” in geometry. TheMpart of the string takes this format:M [start x] [start y]Where
start xis the starting x-position of the curve, andstart yis the starting y-position of the curve.
-
C: TheCattribute draws a cubic curve. As mentioned above, this curve includes three curves, so we will have threeThe
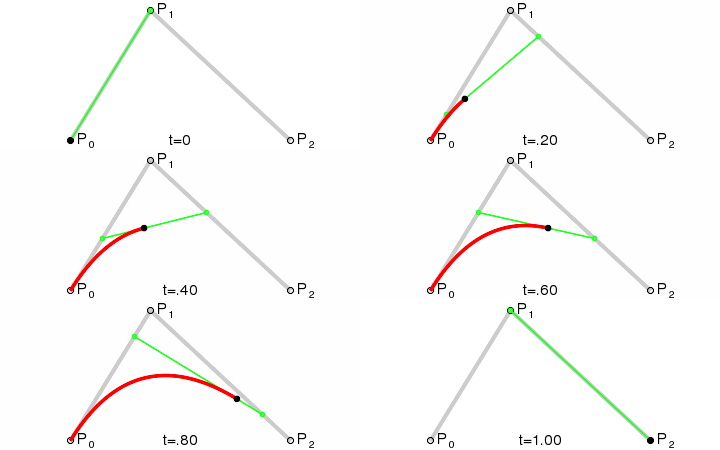
Cattribute takes the following format (line breaks for clarity):C x1 y1 // control point for start of curve: where should the curve start? x2 y2 // control point for center of curve x y // ending point of the curve: where should the curve end?Cubic bezier curves can be difficult to conceptualize—I really like MDN’s glossary page on Bézier curves, which uses the following super-useful graphic to demonstrate the role of each of the three points!


We’re going to have
three
of these C curves in our d string. I’ve
labeled them as 1, 2, and 3 respectively.
-
First curve, furthest to the left:
C [start x] [start y]
[start x + 1/2 width of svg] [start y +- 0.5]
[start x + 1/2 width of svg] [start y +- curveRadius]
start xandstart yare exactly the same as the values stated inM, above.curveRadiusis how deep we want our curve. It’s calculated dynamically based on the width of the SVG container and the height difference between the two elements.
-
Second curve, which is minimally curved and pretty much looks
like a vertical line in most of the pictures:
C [start x + 1/2 width of svg] [start y +- curveRadius]
[start x + 1/2 width of svg] [end y/2]
[start x + 1/2 width of svg] [end y +- curveRadius]
-
Third curve, furthest to the right:
C [start x + 1/2 width of svg] [end y +- curveRadius]
[start x + 1/2 width of svg] [end y +-0.5]
[width of svg, a.k.a. end x] [end y]
Coming away from this pseudocode, you probably have (at least) two questions:
-
Why all this business about the width of the SVG?
Our modal has dynamic width, as should all good web features, in order to accommodate users who use a broad variety of screens. While our start and end y-positions are dynamic based on user selection, our x-positions will always correspond to the width of the SVG container on the screen, which is the distance between two elements. I’ve drawn this out on the image below:
-
Why all this +/- stuff?
We don’t know initially whether the curve will go upwards, downwards, or neither, since a user could choose a left element that’s lower than the right or vice versa, or could choose two elements that are right across from each other. The +/- attributes change depending on this question.
Put all of that together and we have a template for setting the
d attribute for our path, which will be stringified
and set via the DOM’s setAttribute method:
M [start x] [start y]
C [start x] [start y]
[start x + 1/2 width of svg] [start y +- 0.5]
[start x + 1/2 width of svg] [start y +- curveRadius]
C [start x + 1/2 width of svg] [start y +- curveRadius]
[start x + 1/2 width of svg] [end y/2]
[start x + 1/2 width of svg] [end y +- curveRadius]
C [start x + 1/2 width of svg] [end y +- curveRadius]
[start x + 1/2 width of svg] [end y +-0.5]
[width of svg, a.k.a. end x] [end y]
Add an animation to the curve whenever it changes and voilà! We have what looks like one smooth, single curve, which moves dynamically with user input and lends warmth to the feature.
Conclusion
This feature was much bigger than one single line, but you could certainly say that it’s this one line that held it together :)
Ultimately, the effort and time we put into this feature paid off: by the time the first batch of students took this class, many of their first projects were indeed generated directly with the Random Build Generator! Seeing a gallery full of self-portraits made of old keyboards, clocks made from string, and more wacky combinations validated all of the thought and care we put into this feature. Going the extra mile really does make all the difference!